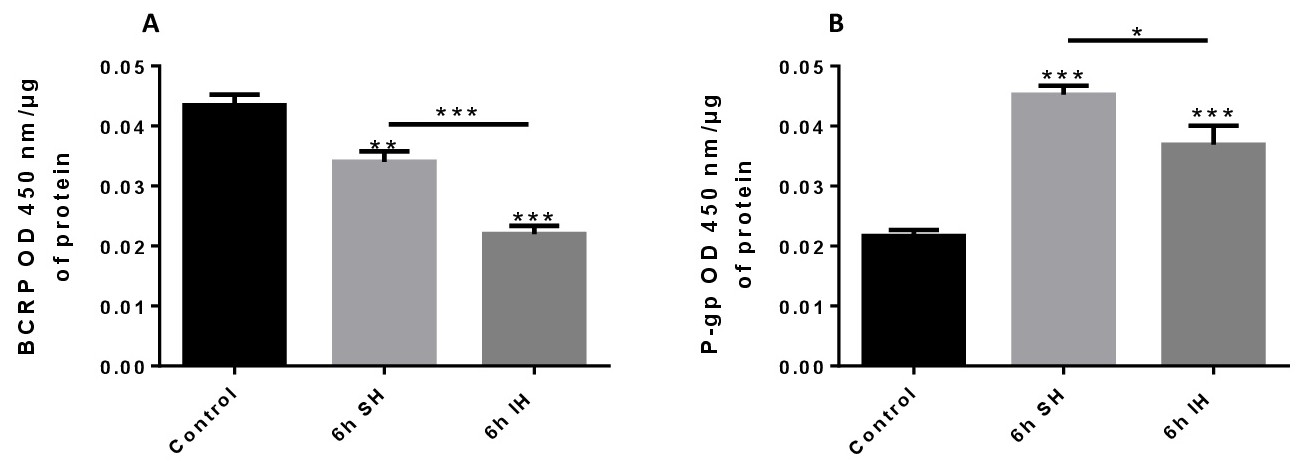
Fig. 5. Expressions of BCRP (A) and P-gp (B) after 6 h of IH or SH in our model of blood-brain barrier. Results are represented as mean value ± SEM (n = 9, N=3), * p≤0.05, ** p≤0.01, *** p≤0.001 compared to control conditions. SH: sustained hypoxia, IH: intermittent hypoxia, control: normal atmospheric gas pressure, BCRP: breast cancer related protein, P-gp: P-glycoprotein.